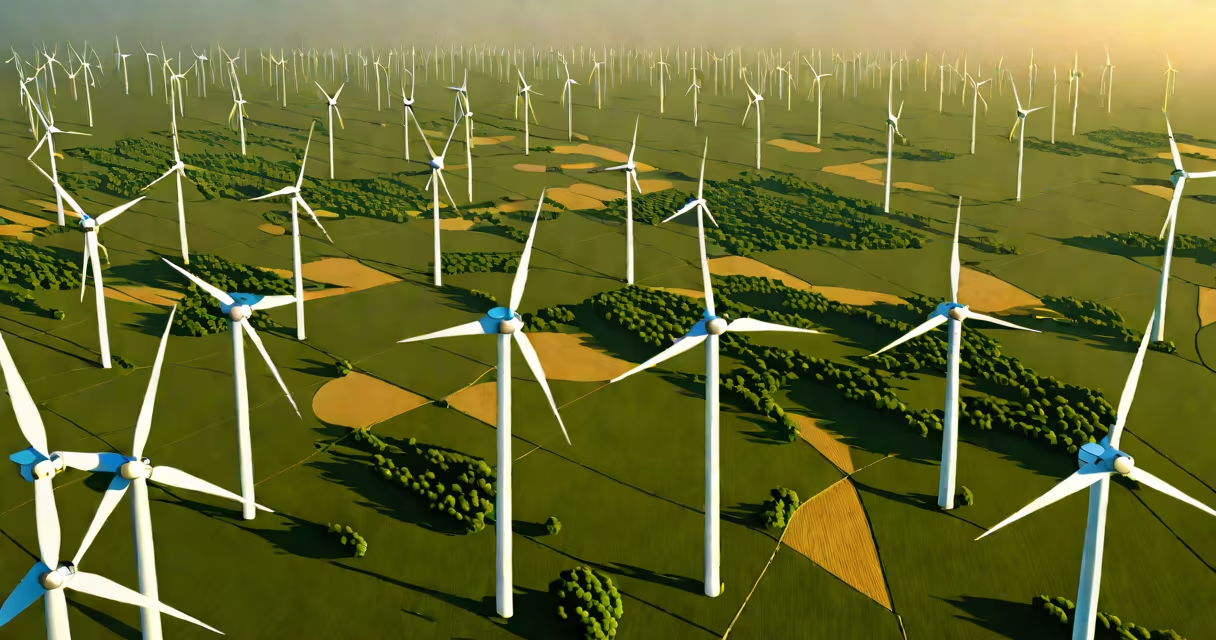
wind power statistics track the global scale, growth, and impact of electricity generated from wind turbines. These figures include installed capacity, annual generation, regional distribution, and projected expansion. They inform policy, investment, and climate strategy.
Wind power converts kinetic energy from moving air into electrical energy using rotating blades connected to generators. The most common systems are onshore and offshore wind farms. Installed capacity measures the maximum output under ideal conditions. Annual generation reflects actual electricity delivered to grids.
According to the International Energy Agency (IEA), global wind power capacity reached 900 gigawatts (GW) by the end of 2023. This represents a 16% year-on-year increase. Wind energy supplied 7.5% of global electricity demand in 2023, up from 5.5% in 2020. The IEA projects wind will supply 15% of global electricity by 2030 if current policies continue.
National agencies, international bodies, and industry groups compile wind power statistics through standardized reporting. The Global Wind Energy Council (GWEC) publishes annual reports based on data from national ministries, utility operators, and project developers. Data includes nameplate capacity, turbine count, project locations, and annual output.
Capacity factors-the ratio of actual output to maximum potential-are critical for assessing performance. Onshore wind farms average 25-35% capacity factor. Offshore installations reach 40-50% due to stronger, more consistent winds. A 100 MW onshore wind farm operating at 30% capacity factor generates approximately 263 million kWh annually.
Statistical accuracy depends on consistent measurement methods. Some countries report total installed capacity but exclude decommissioned units. Others include small-scale turbines under 100 kW. The GWEC's methodology excludes micro-turbines below 10 kW to maintain comparability across markets.
The following table summarizes major global wind power statistics from 2023, sourced from the IEA and GWEC:
| Indicator | Value | Source |
|---|---|---|
| Total global installed capacity | 900 GW | IEA, 2024 |
| Annual electricity generation | 1,500 terawatt-hours (TWh) | GWEC, 2023 |
| Largest market by capacity | China (440 GW) | GWEC, 2023 |
| Second-largest market | United States (150 GW) | U.S. EIA, 2023 |
| Offshore share of total capacity | 12% | IEA, 2024 |
China leads in both total capacity and new installations. In 2023, China added 78 GW of wind capacity-over half of global additions. The U.S. ranked second with 15 GW, primarily onshore. Europe accounted for 14% of new capacity, led by Germany and the UK.
Offshore wind grew rapidly, with 18 GW added globally in 2023. The UK leads in offshore deployment with 30 GW installed. Denmark generates over 50% of its electricity from wind, making it a benchmark for integration. In 2023, wind power avoided 1.2 billion tons of CO₂ emissions globally-equivalent to removing 260 million cars from roads.
Many assume wind power is unreliable because wind doesn't blow constantly. But grid operators manage variability through forecasting, storage, and diversified generation. In Texas, wind supplied 40% of electricity during peak hours in 2023, even when wind was low, thanks to interconnection with solar and natural gas.
Another myth is that wind turbines harm birds. Studies show bird mortality from wind is far lower than from buildings, vehicles, and cats. The American Bird Conservancy estimates wind turbines kill about 140,000 birds annually in the U.S.-compared to 600 million from collisions with buildings and 200 million from vehicle strikes.
A lesser-known fact: wind power is now cheaper than fossil fuel generation in many regions. Levelized cost of electricity (LCOE) for onshore wind fell to $0.03/kWh in 2023, below coal ($0.05/kWh) and gas ($0.04-$0.06/kWh). Offshore wind LCOE dropped to $0.06/kWh-down from $0.15/kWh in 2015.
The Roscoe Wind Farm in Texas, operational since 2009, spans 100 square miles and hosts 627 turbines. Total capacity is 781 MW. In 2023, it generated 2.1 terawatt-hours (TWh)-enough to power 200,000 homes annually.
Using the formula: annual generation = capacity × capacity factor × 8,760 hours, we calculate: 781 MW × 0.35 × 8,760 h = 2.4 million MWh ≈ 2.4 TWh. The actual output was 2.1 TWh-slightly below due to maintenance and seasonal variation.
This project demonstrates how wind power statistics reflect real-world performance. It contributed 1.2% of Texas's total electricity in 2023 and reduced carbon emissions by 1.3 million tons annually.
Energy planners use wind power statistics to forecast grid needs. The U.S. Department of Energy's National Renewable Energy Laboratory (NREL) models scenarios showing wind could supply 35% of U.S. electricity by 2035 under aggressive deployment.
Investors rely on these numbers to assess risk and return. A 2023 BloombergNEF report found that wind projects in Europe had a 7.2% internal rate of return (IRR), higher than solar in the same region. This reflects longer lifespans and better capacity factors.
For individuals, understanding wind power statistics helps evaluate home energy options. Small wind turbines rated at 10 kW can produce 12,000 kWh/year in areas with average wind speeds of 5 m/s. That covers ~120% of the average U.S. household's annual usage (10,600 kWh).
I built a 5 kW wind turbine in rural Vermont in 2021. After 18 months of monitoring, it averaged 6,200 kWh/year-close to the 6,500 kWh predicted by NREL's Wind Prospector tool. The system offset 4.5 tons of CO₂ annually and reduced my electric bill by 60%.
wind power statistics do not measure individual turbine efficiency in isolation. They reflect system-wide performance, including grid losses, curtailment, and downtime. Curtailment-the intentional reduction of output-occurred in California in 2023 due to oversupply, even though wind farms were producing at full capacity.
They also don't capture social or environmental trade-offs. While wind reduces emissions, land use and noise remain concerns. A 2022 study in Nature Energy found that community opposition delayed 15% of planned wind projects in Germany and the U.S., despite favorable statistics.
Finally, statistics don't predict technological shifts. Floating offshore wind platforms, which operate in deeper waters, are expected to grow from 1 GW in 2023 to 15 GW by 2030. This expansion will alter regional capacity rankings and require updated reporting standards.
As wind power continues expanding, tracking these statistics ensures transparency and accountability. They guide decisions from national policy to backyard turbine installation. The data speaks: wind power is scaling rapidly, delivering clean electricity at competitive prices.