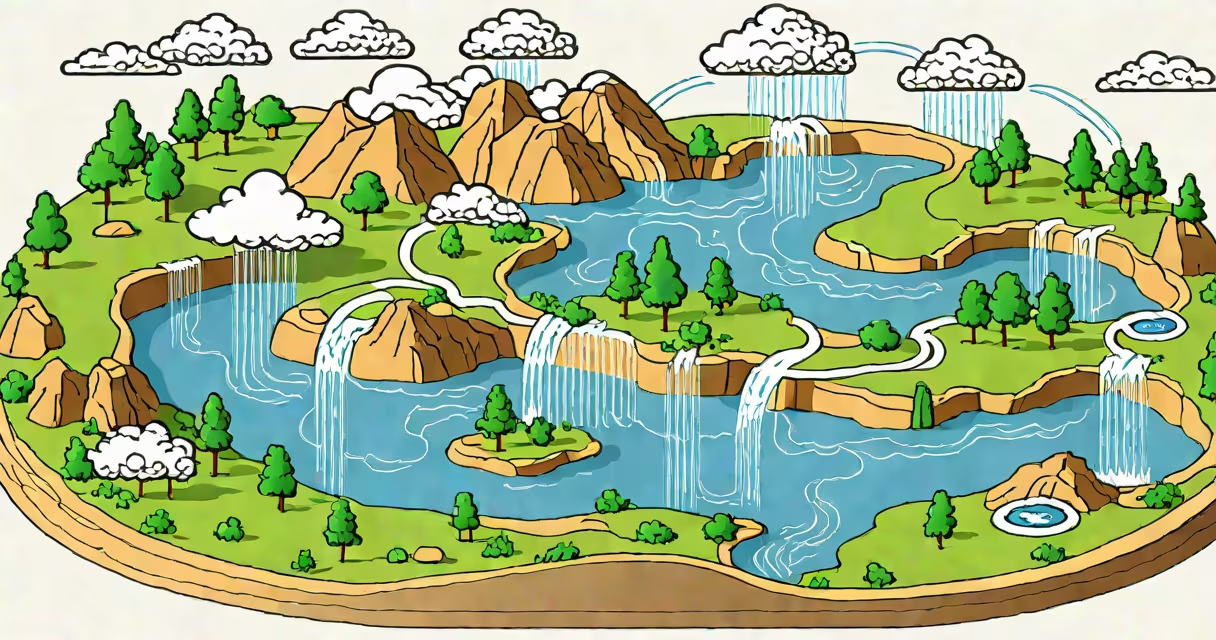
A sketch of the water cycle is a simplified visual representation of how water continuously circulates through Earth's atmosphere, land, and oceans via evaporation, condensation, precipitation, and runoff. It shows the movement of water between reservoirs like oceans, clouds, rivers, and groundwater.
This diagram captures the core stages of the hydrologic cycle: water evaporates from surfaces like lakes and soil, rises and cools to form clouds through condensation, falls as precipitation (rain, snow, sleet), and then flows over land or infiltrates into the ground. The cycle completes when water returns to oceans or collects in bodies of water.
Such sketches are used in classrooms, textbooks, and environmental reports to explain how water is redistributed across the planet. They emphasize continuity rather than exact measurements, making them ideal for teaching foundational concepts in earth science.
The sketch models the physical processes driving water movement. Solar energy heats surface water, causing evaporation-the phase change from liquid to vapor. This vapor rises into the atmosphere, where cooler temperatures trigger condensation into tiny droplets, forming clouds.
When droplets grow large enough, gravity pulls them down as precipitation. Rain falls on land, filling rivers and streams, while snow accumulates in mountains. Runoff carries water back toward oceans, and infiltration allows some water to seep into soil and rock layers, becoming groundwater.
Water doesn't vanish-it transforms and relocates. A single drop may evaporate from a lake, travel 500 kilometers in a weather system, fall as rain in a forest, run off into a river, and eventually return to the sea-all within days or weeks. The sketch tracks this process without requiring precise timing or volume.
While all sketches follow the same sequence, they differ in focus and complexity. Some emphasize human impact, others show regional differences or seasonal variation.
| Type | Focus | Use Case |
|---|---|---|
| Basic Diagram | Four-stage loop: evaporation, condensation, precipitation, collection | Elementary education, quick reference |
| Regional Variation | Shows how climate affects cycle speed and form (e.g., snow vs. rain) | Climate studies, geography lessons |
| Human Impact Add-on | Includes urban runoff, dams, irrigation, deforestation | Environmental science, policy discussions |
For example, a sketch of the water cycle in arid regions includes less runoff and more evaporation due to low vegetation and high heat. In contrast, tropical zones show heavy rainfall and rapid runoff due to dense forests and frequent storms.
Many assume the water cycle ends when rain hits the ground. But water continues moving underground and through ecosystems. A sketch often omits subsurface flow, which accounts for nearly 30% of total water movement in many watersheds, according to the U.S. Geological Survey.
Another error is thinking evaporation only happens from oceans. In reality, plants release water vapor through transpiration-a process that contributes about 10% of atmospheric moisture globally. A complete sketch should include both evaporation and transpiration under "evaporation" or label them separately.
Some diagrams imply water flows directly from clouds to rivers. In truth, precipitation lands on soil, rocks, or vegetation. Only a fraction becomes immediate runoff. The rest is absorbed, stored temporarily, or evaporated back into the air. This delay affects flood risk and drought patterns.
Consider the Colorado River, which supplies water to seven U.S. states and Mexico. A sketch of the water cycle here would show snowpack in the Rocky Mountains melting in spring, feeding rivers that flow southward. But human infrastructure alters the natural path.
Reservoirs like Lake Powell store water for cities and farms. When released, water flows downstream, but much evaporates during transit-up to 15% annually in hot, dry conditions. This loss isn't always visible in basic sketches, yet it impacts long-term water availability.
According to the National Oceanic and Atmospheric Administration (NOAA), the basin has experienced reduced snowpack since 1950 due to rising temperatures. A modern sketch of the water cycle in this region would include climate change effects-less snow, earlier melt, increased evaporation-as part of the feedback loop.
Understanding a sketch of the water cycle helps predict droughts, manage water resources, and assess climate change impacts. For instance, during California's 2012-2016 drought, officials used updated water cycle models to allocate limited supplies.
These models rely on accurate representations of evaporation rates, cloud formation, and soil absorption. Without a clear sketch, students and policymakers struggle to grasp how small changes in temperature or land use affect entire ecosystems.
I once spent a week observing streamflow in a mountain watershed. I saw how a single storm could saturate the soil, triggering flash floods. The local school's water cycle diagram showed only slow runoff-but real-world dynamics included sudden saturation and rapid drainage. That mismatch revealed why even simple sketches need context.
Each sketch simplifies reality. But even a basic version teaches that water is never lost-it's constantly being recycled. This principle underpins global sustainability efforts and informs decisions about farming, city planning, and disaster preparedness.
By understanding the structure and limitations of a sketch of the water cycle, you gain insight into Earth's most important resource. It's not just a classroom tool-it's a foundation for managing water in a changing world.