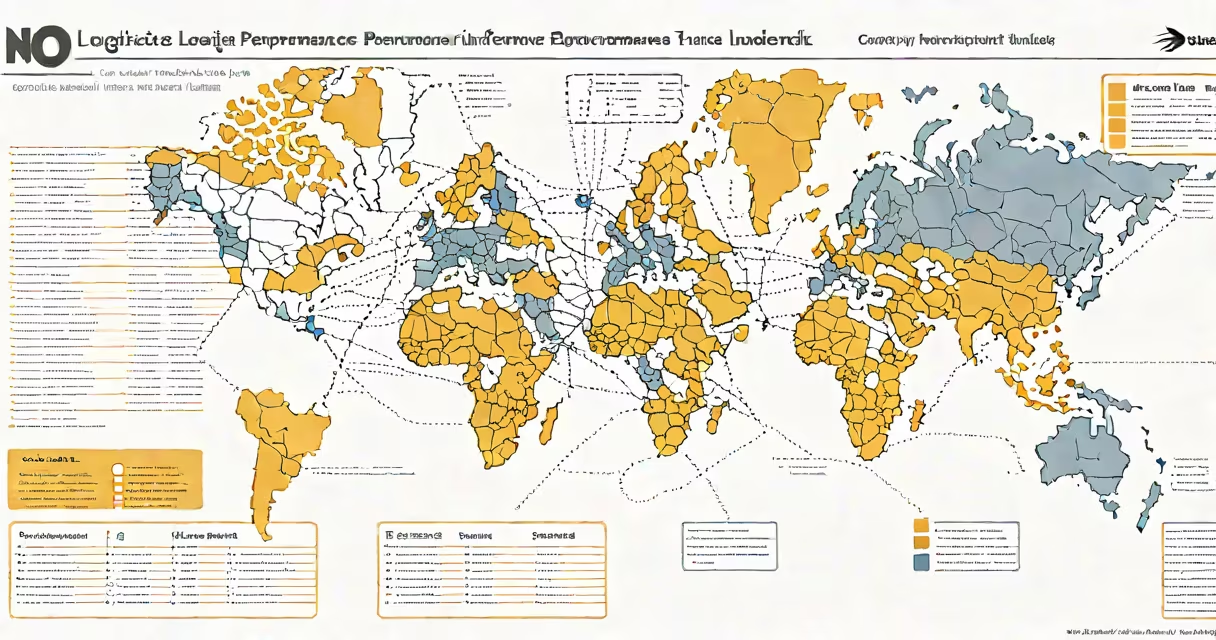
The logistics performance index (LPI) is a composite score published by the World Bank that evaluates how efficiently countries move goods across borders. It ranks 160 economies based on six core dimensions: customs, infrastructure, international shipments, logistics competence, tracking and tracing, and timeliness. The index uses survey data from global freight forwarders and logistics providers to assess real-world performance.
Developed in 2007 and updated biennially, the LPI aggregates responses from over 10,000 private-sector firms operating in international trade. Each economy receives a score between 1 and 5 on each dimension, then the average is calculated and normalized to a scale of 0 to 100. A higher score indicates faster, more reliable cross-border movement of goods. For example, in the 2023 report, Germany scored 78.3, while Afghanistan scored 34.2.
Unlike static trade statistics, the LPI reflects operational realities. It captures how quickly shipments clear customs, whether roads and rail lines support timely delivery, and how well companies track cargo. These factors directly affect business costs and market access. A 1-point increase in the LPI correlates with a 1.5% reduction in trade costs, according to World Bank analysis.
The LPI is built from surveys sent to logistics professionals who manage cross-border shipments. Respondents rate their experiences in specific countries using a five-point scale: 1 = poor, 5 = excellent. The survey covers six domains:
| Dimension | Definition | Sample Question |
|---|---|---|
| Customs | Speed and predictability of border clearance | "How long does it take to clear customs?" |
| Infrastructure | Quality of roads, rail, ports, and air transport | "Are port facilities adequate for container handling?" |
| International Shipments | Efficiency of exporting and importing processes | "Is documentation required for exports processed quickly?" |
| Logistics Competence | Availability of skilled labor and advanced systems | "Do local logistics providers have trained staff?" |
| Tracking & Tracing | Ability to monitor cargo in real time | "Can you track your shipment throughout transit?" |
| Timeliness | Reliability of on-time delivery | "How often do shipments arrive within the promised timeframe?" |
Each domain contributes equally to the score. Data is collected through structured online interviews with logistics managers in major trading hubs. The World Bank validates responses using internal consistency checks and outlier detection algorithms.
For instance, in 2023, Singapore ranked first globally with a score of 84.2. Its high marks came from a 92% on-time delivery rate (timeliness), 4.8/5 for tracking and tracing, and 4.7/5 for customs efficiency. These results reflect investments in automated border systems and integrated digital platforms like SingPass Trade.
The LPI is not a single metric but a weighted average of six distinct performance areas. Each component draws from different aspects of supply chain operations. Infrastructure quality includes road density, port capacity, and rail connectivity. Customs performance depends on digital documentation, automated inspection systems, and staff training levels.
Logistics competence is assessed through provider capabilities-whether firms use enterprise resource planning (ERP) software, have certified staff, or offer multi-modal solutions. Tracking and tracing rely on GPS integration, barcode scanning, and real-time updates via APIs. Timeliness is measured by actual delivery records, not self-reported estimates.
A key insight from the 2023 report: countries with high infrastructure scores don't always achieve high LPI rankings. Japan, for example, scored 4.6 on infrastructure but only 4.1 on logistics competence. This gap revealed that even with excellent physical assets, weak human capital and outdated IT systems hinder performance. The World Bank noted that "infrastructure investment alone cannot close the efficiency gap" (World Bank, 2023, p. 17).
Nations use the LPI to benchmark progress in trade policy reform. The World Bank cites it as a tool for identifying bottlenecks in national supply chains. India, for example, improved its LPI score from 38.4 in 2016 to 53.1 in 2023 after implementing the National Logistics Policy and digitizing customs clearance through the ICEGATE portal.
Private companies reference the LPI when selecting suppliers or planning distribution networks. A multinational retailer evaluating warehouse locations in Southeast Asia might prioritize Vietnam over Cambodia due to Vietnam's higher LPI ranking (57.4 vs. 45.8). This choice reduces risk of shipment delays and lowers inventory holding costs.
Investors also track LPI changes. A study by the OECD found that a 10-point rise in the LPI correlated with a 2.3% increase in foreign direct investment inflows over five years (OECD, 2022, p. 41). This shows that logistics efficiency signals economic stability and openness to trade.
Many assume the LPI measures only transportation speed. That's incorrect. It evaluates the entire trade process-from document submission to final delivery. A country can have fast trucks but slow customs, dragging down its score.
Another error is treating the LPI as a measure of GDP or economic growth. It's not. A nation with a high GDP may still rank low if its logistics systems are fragmented. The UAE, for example, has a $440 billion GDP but ranked 18th in LPI (62.5) due to inconsistent port coordination and limited rural connectivity.
Some confuse the LPI with the Global Competitiveness Index (GCI). While both assess trade readiness, the GCI includes innovation, education, and financial sector strength. The LPI focuses solely on movement of goods. A country can score highly on the GCI but poorly on LPI if its transport networks are underdeveloped.
One non-obvious fact: the LPI excludes data from conflict zones. Countries experiencing war or political instability are not included in the latest reports. This ensures reliability but creates blind spots. For example, Ukraine was excluded from the 2023 LPI due to ongoing hostilities, despite pre-war scores of 57.2.
In 2018, Kenya launched the National Integrated Border Management System (NIBMS), integrating customs, immigration, and health inspections into a single digital platform. Prior to this, exporters waited an average of 72 hours to clear customs. After implementation, the average dropped to 18 hours.
By 2023, Kenya's LPI score rose from 42.1 to 56.7-a 34% improvement. The World Bank attributed this to reduced paperwork, automated risk assessments, and shared data systems across agencies. In one case, a Kenyan exporter shipped fresh mangoes to Dubai. Previously, the cargo arrived late and spoiled. After NIBMS, the same shipment cleared customs in 12 hours and reached the market on time.
This outcome illustrates how institutional reform directly improves measurable logistics outcomes. The LPI doesn't just describe performance-it reveals where action is needed.
Understanding the logistics performance index helps governments, businesses, and investors make informed decisions about trade routes, supplier selection, and infrastructure investment. It provides a standardized, evidence-based view of how well the world moves goods. As global supply chains grow more complex, the LPI remains a critical tool for measuring real-world efficiency.