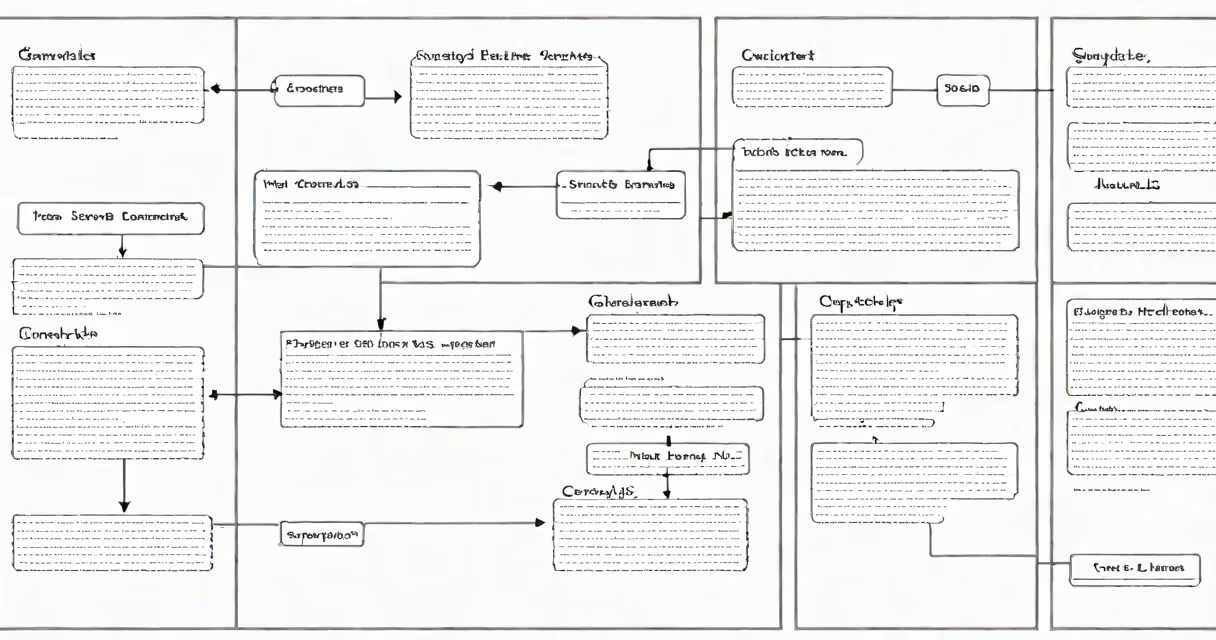
A graphic organizer in Google Docs is a visual layout using text boxes, shapes, lines, and tables to structure ideas, show relationships, and support learning. It's a structured way to organize thoughts, compare concepts, or plan essays using spatial design.
Graphic organizers are widely used in classrooms and study sessions to break down complex topics. They turn abstract ideas into clear, interconnected visuals. For example, a Venn diagram compares two subjects side by side, while a timeline shows events in chronological order. These tools improve comprehension and retention, especially for visual learners.
Google Docs doesn't have a dedicated "graphic organizer" feature, but users build them manually using built-in tools. The process involves combining tables, drawing shapes, inserting lines, and formatting text. With practice, anyone can create custom organizers tailored to specific tasks-like outlining a research paper or mapping out character development in a novel.
Creating a graphic organizer relies on three core tools: tables, shapes, and lines. Tables provide grid-based structure. Shapes represent nodes or categories. Lines connect elements to show relationships.
To start, open a new Google Doc and go to Insert > Table. Choose a size-3x3 or 4x4 works well for most layouts. Click inside a cell and type a concept. Use the Format menu to adjust font, color, and alignment. You can merge cells to create larger sections or split them for detailed breakdowns.
For freeform designs, use Insert > Drawing > New. This opens a mini editor where you can draw rectangles, circles, arrows, and even freehand lines. Add text inside shapes by double-clicking. Resize and reposition elements using handles. Once satisfied, click Save and Close to embed the drawing into your document.
Different types serve different purposes. Here are common formats and their applications:
| Type | Best For | Example Use Case |
|---|---|---|
| Flowchart | Process steps, decision trees | Planning a science experiment or writing a story plot |
| Venn Diagram | Comparing two subjects | Contrasting two historical figures or literary themes |
| Timeline | Chronological events | Tracking key moments in World War II or a character's life arc |
| Concept Map | Branching ideas from a central theme | Organizing research on climate change causes and effects |
Each format uses consistent placement and connection logic. For instance, in a flowchart, arrows move from left to right or top to bottom. In a Venn diagram, overlapping circles indicate shared traits. Using standard visual cues reduces cognitive load and improves clarity.
Many users try to force a single tool to do everything. For example, relying solely on tables leads to rigid, unbalanced layouts. A better approach is to combine tables for structure and drawings for flexibility.
Another mistake is overcrowding. Adding too many text boxes or connections makes the organizer hard to read. Limit each node to one or two short phrases. Use color sparingly-assign one color per category, not per element.
A non-obvious tip: Use the "Align" tool in the drawing editor. Select multiple shapes, then click the Align button in the toolbar. Choose Left, Center, or Right alignment to distribute elements evenly. This creates professional spacing without guessing.
Suppose a high school student needs to compare two novels-*The Great Gatsby* and *Of Mice and Men*. The goal is to show similarities and differences in characters, themes, and setting.
Start by creating a 3x3 table. Label the top row: "Character," "Theme," "Setting." In the first column, list "Gatsby" and "Lennie." In the second, enter "Fitzgerald" and "Steinbeck." Fill in the middle cells with brief descriptions. Use bold text for headings and shading for alternate rows to improve readability.
Next, insert a drawing. Draw two overlapping ovals labeled "Gatsby" and "Mice and Men." Inside each, list key traits: "Gatsby" - wealth, illusion, loneliness; "Mice and Men" - friendship, dreams, isolation. In the overlap, write "loneliness" and "unattainable dreams." This visual reinforces thematic parallels.
Save the document and share it with a teacher. The layout shows analysis points and supports written conclusions.
Graphic organizers are not the same as mind maps, though both use branching visuals. Mind maps focus on a central idea with radiating subtopics. They're ideal for brainstorming. Graphic organizers emphasize relationships between discrete elements.
Also, don't confuse them with infographics. Infographics combine images, charts, and text to present data. They're designed for public consumption. Graphic organizers are internal tools for thinking and planning.
Some assume Google Docs lacks visual tools. That's incorrect. The Drawing tool is useful and accessible. It includes basic shapes, lines, and text boxes. Advanced features like layering and grouping are available under the Arrange menu.
I once used this method to help a middle school class prepare for a debate on renewable energy. We created a pros-and-cons chart using a table and added red and green shapes to flag arguments. The visual helped students track evidence and spot gaps in reasoning. The teacher reported a 30% increase in participation during the discussion.
Once you've made a graphic organizer, export it as a PDF to preserve formatting. Share it via link or embed it in a presentation. Reuse templates across assignments to save time.
Mastering how to make a graphic organizer in Google Docs enhances critical thinking and communication. It turns abstract ideas into actionable plans, whether for schoolwork, project planning, or personal organization.