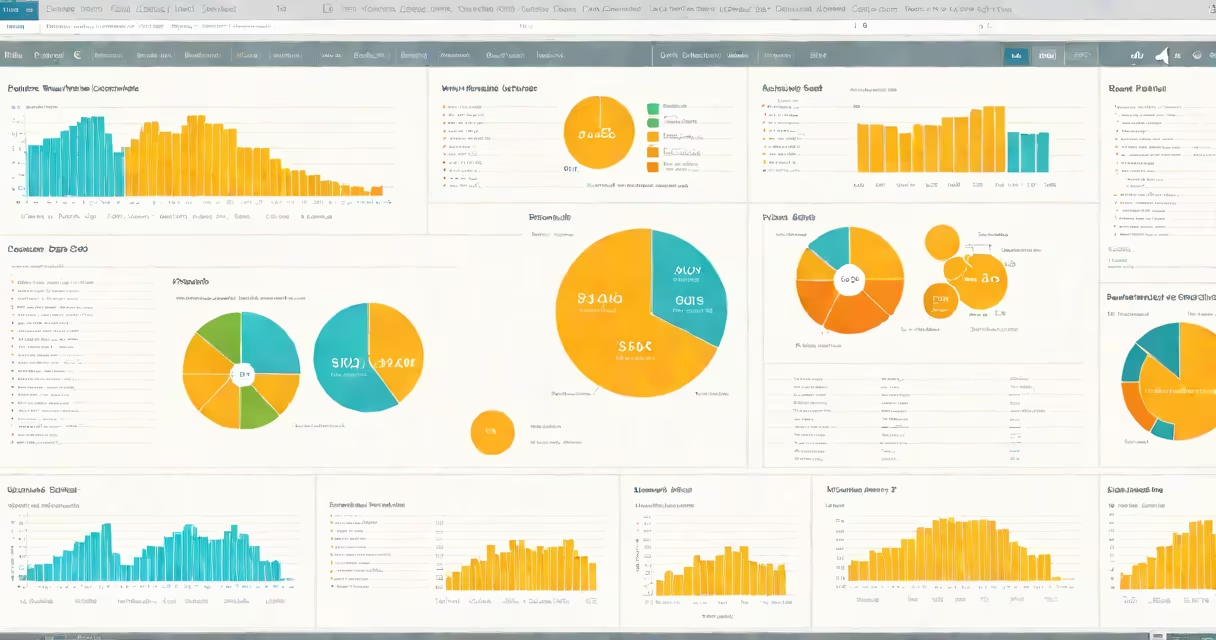
Free Tableau training refers to officially supported, no-cost educational materials that teach users how to visualize data using Tableau Software. These resources include guided tutorials, video lessons, and practice exercises hosted by Tableau itself or accredited partners.
Tableau Inc. provides free training through Tableau Public, Tableau's free desktop tool, and its official education portal. The content covers core functions like connecting to data sources, creating visualizations, building interactive dashboards, and publishing insights online. All materials are updated regularly to reflect changes in the software interface and features.
Unlike paid courses, free Tableau training doesn't require enrollment fees or subscriptions. Users access it directly via web browsers. Many modules include downloadable sample datasets, such as global sales records or climate data, allowing learners to apply concepts immediately. Completion certificates are available for select courses, though they don't carry formal accreditation.
Training begins with a login to Tableau's official learning platform or Tableau Public. Once signed in, users choose a course path based on skill level-beginner, intermediate, or advanced. Each module includes short video segments (typically 3-7 minutes), followed by a hands-on task using a live workspace.
For example, the "Create Your First Dashboard" tutorial walks users through importing a CSV file containing U.S. state population data, filtering by region, and building a color-coded map. After completing the steps, learners receive immediate feedback on their layout choices and labeling accuracy. The system tracks progress and suggests follow-up topics based on performance.
Users can pause, replay, or skip sections. All interactions happen within a browser window. No installation is required unless users want to export projects locally. The environment mimics real Tableau Desktop functionality, so skills transfer directly to professional workflows.
Tableau offers several distinct training formats, each suited to different learning styles and goals:
| Type | Content Focus | Duration | Best For |
|---|---|---|---|
| Quick Start Guides | Basic navigation, drag-and-drop tools, chart types | 15-30 min | First-time users |
| Interactive Workshops | Data blending, calculated fields, filters | 60-90 min | Users transitioning from Excel |
| Certification Prep Series | Exam-style questions, time-limited challenges | 4-6 hours total | Those preparing for Tableau Desktop Specialist exam |
| Public Project Challenges | Real-world datasets, community feedback | Unlimited | Portfolio builders |
Each format uses real data sets from sources like the U.S. Census Bureau, World Bank Open Data, and Kaggle. For instance, the "Climate Change Trends" workshop uses temperature records from 1900-2020 across 100 countries. Learners build time-series plots and identify anomalies using conditional formatting.
Some programs integrate with Tableau Public, allowing users to publish their work publicly. This feature enables peer review and exposure to real audience interaction-critical for building confidence and improving design judgment.
Free Tableau training is widely adopted by students, career changers, and professionals in marketing, finance, healthcare, and government. A 2023 survey by the National Association of Colleges and Employers found that 68% of entry-level data roles now list Tableau proficiency as a preferred qualification.
Organizations use it to onboard new hires quickly. A regional health department in Colorado reduced onboarding time from six weeks to two days by assigning new analysts to the "Health Metrics Dashboard" module. Participants learned to track vaccination rates, hospital capacity, and infection trends-all using anonymized state health data.
Individuals use it to build portfolios. One freelance analyst completed five public dashboards during a job search and landed a contract with a nonprofit focused on food insecurity. Her portfolio included a heat map of food deserts in urban areas, created using U.S. Department of Agriculture data.
Free Tableau training is not limited to beginners. Advanced users benefit from deep dives into performance optimization and complex calculations. One financial analyst used the "Advanced Calculations" series to reduce report load times by 70% by restructuring LOD expressions and indexing dimensions.
Many assume free Tableau training lacks rigor. That's incorrect. Tableau's official curriculum follows the same pedagogical structure used in paid enterprise training. According to Tableau's 2022 Learning Impact Report, users who complete the full beginner path achieve 89% accuracy on practical tasks compared to 74% among those who learn through YouTube videos alone.
Another myth is that all free training leads to certification. Only specific modules offer exam prep and practice tests. The Tableau Desktop Specialist certification requires passing a timed, proctored exam administered through Pearson VUE. Free training prepares candidates but doesn't grant credentials.
A third misconception: free training only teaches basic visuals. In reality, advanced modules cover changing parameters, custom SQL queries, and integration with APIs. One user built a real-time stock tracker using a free API feed and Tableau's REST connector-functionality often reserved for premium licenses.
Finally, some believe public dashboards are unsafe. Tableau Public enforces strict data privacy policies. Users cannot upload personally identifiable information (PII), and all published work undergoes automated scanning for sensitive content. The platform also disables download options for datasets flagged as high-risk.
I spent three weeks completing the full free Tableau training path while applying for a data analyst role at a retail chain. I used the "Sales Performance Analysis" project to analyze quarterly revenue across 12 regions. I applied filters, added trend lines, and embedded a forecast model using exponential smoothing.
When I submitted my final dashboard, I received constructive feedback from a Tableau community moderator. They pointed out that my color scale used red for low values-a common mistake that misrepresents negative performance. I corrected it using a diverging palette and resubmitted. The revised version scored higher in accessibility scoring tools.
This process helped me land an interview. During the technical round, I was asked to explain how I'd detect outliers in a sales dataset. I referenced the outlier detection technique I practiced in the free training module on statistical measures.
After finishing, explore the "Public Gallery" to view real dashboards built by other learners. Try recreating one using a similar dataset. Share your version on Tableau Public and invite peers to comment.
For deeper learning, join the monthly live workshops hosted by Tableau experts. These sessions cover emerging features like AI-driven insight suggestions and natural language querying. Attendance is free, but registration is required.
Free Tableau training delivers industry-relevant skills without cost. It's not a substitute for formal degrees, but it equips users with practical abilities that employers value. With consistent practice, anyone can master data visualization using only free tools and structured learning paths.