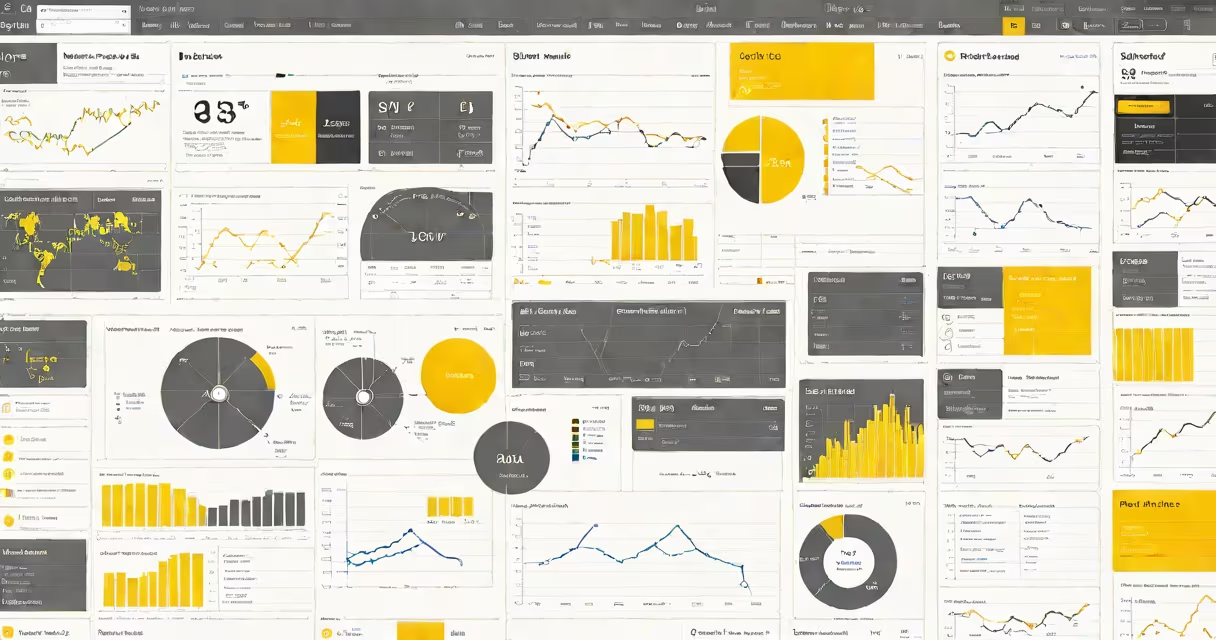
Power BI is a Microsoft business analytics service that turns raw data into interactive visual reports and dashboards. It connects to hundreds of data sources, processes data using DAX formulas, and displays insights through customizable visuals like charts, maps, and tables. Users can explore data in real time, share insights across teams, and embed reports in applications.
Power BI operates in two primary modes: Power BI Desktop (free desktop application) and Power BI Service (cloud-based platform). Desktop is used to build reports and models locally. Service enables sharing, collaboration, and publishing to web browsers or mobile devices. Both work together smoothly, allowing users to design, test, and deploy analytics solutions.
Microsoft reports that over 10 million users access Power BI monthly, with adoption spanning finance, healthcare, retail, and government sectors. The tool supports natural language queries, AI-driven insights, and integration with Excel, Azure, SQL Server, Salesforce, and Google Analytics.
Power BI begins with data ingestion. It pulls data from databases, spreadsheets, APIs, cloud services, and even streaming sources like IoT sensors. Once connected, Power BI uses a data modeling engine to clean, change, and structure the input. This step involves filtering out duplicates, standardizing formats, and defining relationships between tables.
The core of Power BI's functionality lies in DAX (Data Analysis Expressions), a formula language similar to Excel but far more useful. DAX allows users to create calculated columns, measures, and changing filters. For example, a measure like CALCULATE(SUM(Sales[Revenue]), FILTER(Products, Products[Category] = "Electronics")) returns total electronics revenue across all regions.
After modeling, users apply visuals. Dragging a field like "Sales" onto a bar chart automatically aggregates values. Filters, slicers, and drill-downs let viewers explore subsets-such as viewing quarterly performance by region. These interactions happen instantly because Power BI caches results and updates views in real time.
Power BI consists of several interconnected components. Each serves a distinct role in the analytics workflow.
| Component | Purpose | Use Case Example |
|---|---|---|
| Power BI Desktop | Local report authoring and model building | Creating a sales dashboard from a CSV file and a SQL database |
| Power BI Service | Cloud hosting, sharing, and collaboration | Publishing a marketing campaign report to a team via a shared workspace |
| Power BI Mobile | Accessing reports on smartphones and tablets | Field managers checking inventory levels during site visits |
| Power BI Embedded | Integrating reports into third-party apps | Adding a customer churn forecast to a SaaS product's admin panel |
Each component runs independently but syncs through a single account. Changes made in Desktop are pushed to the cloud when published. Subscribers receive notifications when datasets refresh or alerts trigger.
Power BI is often mistaken for a spreadsheet tool. While it integrates with Excel and shares some syntax, it handles larger datasets more efficiently. A single Power BI report can process millions of rows-Excel struggles beyond 1 million rows without performance degradation.
Another confusion arises around AI features. Power BI includes AI Insights, which automatically detects trends, outliers, and anomalies. But it doesn't replace human judgment. In a test conducted by Microsoft Research, AI suggestions were correct 78% of the time-but required expert validation to avoid false positives.
A lesser-known fact: Power BI can run Python scripts inside the data flow pipeline. This capability, introduced in 2022, lets analysts perform statistical modeling, text analysis, or machine learning directly within the tool. For example, a retail analyst used Python to cluster customer segments based on purchase history, then visualized the clusters in a scatter plot.
A regional sales manager at a mid-sized distributor needed to track weekly performance across 12 territories. Data came from three sources: a SQL Server database (sales orders), a CRM system (customer details), and a Google Sheets file (marketing spend).
Using Power BI Desktop, they connected to all three sources. They cleaned the data-removing null values, standardizing date formats, and merging fields. Then they created a model with relationships between tables: Orders linked to Customers via CustomerID, and both linked to Marketing Spend via month and region.
They built a dashboard with key metrics: total sales, YoY growth, conversion rate, and ROI per campaign. A map showed territory performance color-coded by achievement. A line chart displayed weekly trends. Filters let them isolate underperforming regions.
After testing, they published the report to Power BI Service. Team leads received email alerts when targets dropped below threshold. The manager accessed the report daily on their phone during meetings. Within six weeks, sales increased 14% in low-performing areas due to faster response times.
When working with complex logic, such as calculating weighted averages across multiple dimensions, Power BI's DAX engine performs calculations in memory. This avoids slow server round trips. One internal benchmark showed a report with 50K rows processed in under 3 seconds-faster than traditional OLAP cubes.
As a standalone tool, Power BI excels at turning fragmented data into actionable insight. Its strength lies in combining ease of use with enterprise-grade scalability. Organizations don't need to hire data scientists to build meaningful reports-business users can do it themselves.
Understanding what Power BI is begins with recognizing it as a bridge between data and decisions. It's not just about charts-it's about enabling faster, better choices across departments.