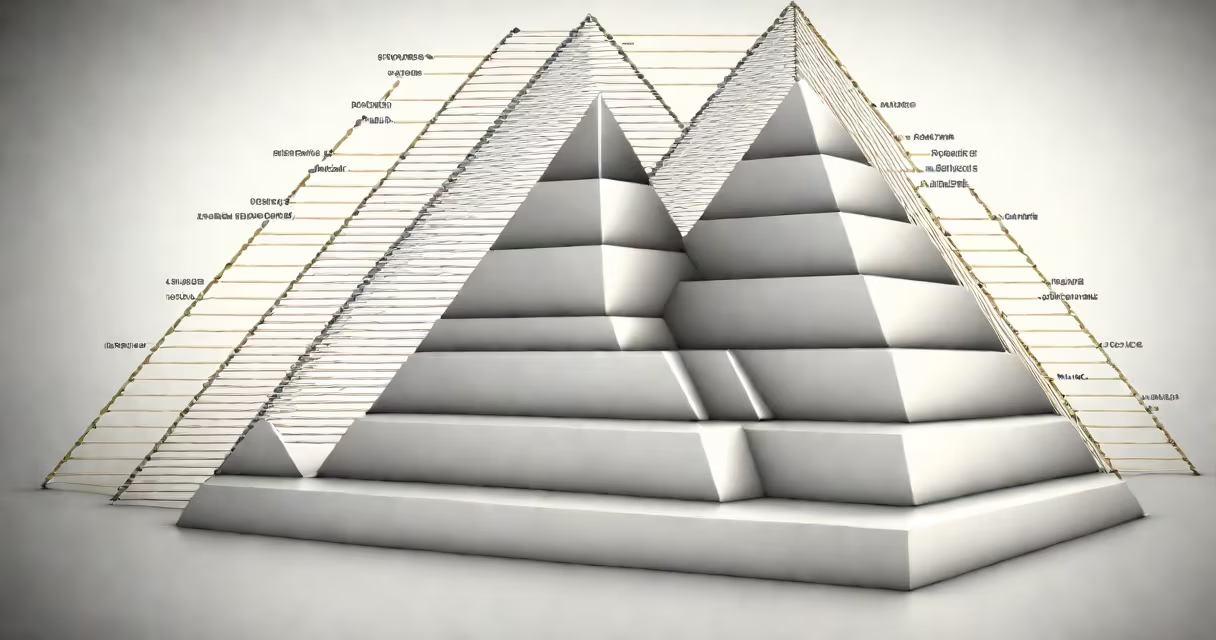
An energy pyramid in ecology is a graphical representation showing the flow of energy through trophic levels in an system, with producers at the base and top consumers at the apex. Each level represents a group of organisms that share the same role in energy transfer, and energy decreases at each step due to metabolic losses.
Energy enters ecosystems primarily through photosynthesis. Plants, algae, and other autotrophs convert solar energy into chemical energy stored in organic compounds. This forms the base of the energy pyramid. When herbivores eat plants, they gain only about 10% of the energy originally captured by the producers. The remaining 90% is lost as heat, used for movement, growth, or excretion. Carnivores that consume herbivores receive even less-typically around 10% of the energy available at the previous level.
This pattern follows the 10% rule, a widely accepted estimate based on long-term ecological studies. For example, in a grassland system, if producers capture 1 million kilocalories of solar energy per square meter annually, herbivores may obtain only 100,000 kcal, and carnivores feeding on them may receive just 10,000 kcal. This progressive reduction limits the number of top predators an system can support.
Energy pyramids are structured vertically, with the broadest layer at the bottom and progressively narrower layers above. The width of each layer reflects the amount of energy available at that trophic level. This visual design emphasizes the inefficiency of energy transfer between levels.
At each stage, energy is used for respiration, reproduction, and movement. Only a fraction of consumed energy becomes biomass-the living tissue that can be passed to the next level. The rest is released as heat, which cannot be reused by organisms. This irreversible loss means energy flows in one direction through ecosystems, unlike nutrients, which cycle.
A study of the Silver Springs system in Florida confirmed this pattern. Researchers measured energy flow across trophic levels and found that only 10-20% of energy was transferred from one level to the next. These findings align with data from the National Oceanic and Atmospheric Administration (NOAA), which notes that energy transfer efficiency averages 10% across most natural systems.
While energy pyramids are always upright, other types of ecological pyramids differ in shape depending on what is being measured. Biomass and numbers pyramids can sometimes be inverted, but energy pyramids never are.
| Type | What It Measures | Shape in Most Ecosystems | Why It Matters |
|---|---|---|---|
| Energy pyramid | Total energy available per unit area per time | Always upright | Shows irreversible energy loss; explains why top predators are rare |
| Biomass pyramid | Total dry mass of organisms at each level | Usually upright, but can invert in aquatic systems | Reveals how much living material supports each level |
| Numbers pyramid | Total count of individual organisms | Often upright, but can invert (e.g., one tree supports many insects) | Highlights population size differences across levels |
The key distinction lies in what each pyramid tracks. Energy pyramids reflect actual energy flow, making them the most accurate model for understanding system dynamics. Biomass and numbers pyramids can mislead if interpreted without context-especially in marine environments where small, abundant phytoplankton support larger animals.
Many assume that energy pyramids represent equal or high transfer rates between levels. In reality, the 10% rule is a conservative average. Some transfers fall below 5%, especially in cold-blooded animals with low metabolic demands. Conversely, in highly efficient systems like certain insect-based food webs, transfer efficiency can reach 15%.
Another misunderstanding is that energy pyramids show nutrient cycling. They do not. Nutrients such as nitrogen and phosphorus are recycled within ecosystems through decomposition and microbial activity. Energy, however, is not recycled-it enters as sunlight and exits as heat.
A third error is equating biomass with energy. A forest may have more biomass in trees than in deer, but the energy available to deer is far less than what's stored in the trees. This is why a single wolf requires a large territory to meet its energy needs-its prey provides limited energy, and the wolf must consume many individuals to survive.
In Yellowstone, elk populations feed on grasses and shrubs. Wolves prey on elk. The energy pyramid here shows that the primary producers (grasses) capture about 10,000 kcal/m²/year. Elk, as primary consumers, receive roughly 1,000 kcal/m²/year. Wolves, secondary consumers, get only about 100 kcal/m²/year.
When wolves were reintroduced in 1995, their presence reduced elk numbers, allowing vegetation to recover. This restored energy flow to lower levels. A 20-year study by the U.S. Geological Survey documented increased plant biomass and improved soil stability-proof that altering one level affects the entire pyramid.
I observed this firsthand during a field trip to the park. Standing near a riverbank, I saw willow saplings regrow after years of being browsed. The return of willows supported beavers, whose dams altered water flow and created new habitats. This cascade illustrates how energy pyramids govern system function-not just energy transfer, but species interactions and habitat change.
Understanding the energy pyramid explains why large predators are rare. A lion in the Serengeti needs to kill multiple gazelles per week. Each gazelle represents a small fraction of the energy originally captured by grasses. Without constant input from the sun, the entire system collapses.
It also informs conservation. Protecting top predators often requires preserving vast areas of habitat because they depend on energy from lower levels. Deforestation reduces producer capacity, shrinking the base of the pyramid and threatening all higher levels.
According to the World Wildlife Fund, over 60% of global vertebrate populations have declined since 1970, partly due to disruptions in energy flow. Habitat fragmentation, pollution, and climate change alter energy availability at the base, weakening entire food webs.
Energy pyramid in ecology is not just a classroom diagram-it's a structure for predicting system collapse, guiding restoration efforts, and managing natural resources. Its principles apply from coral reefs to boreal forests.