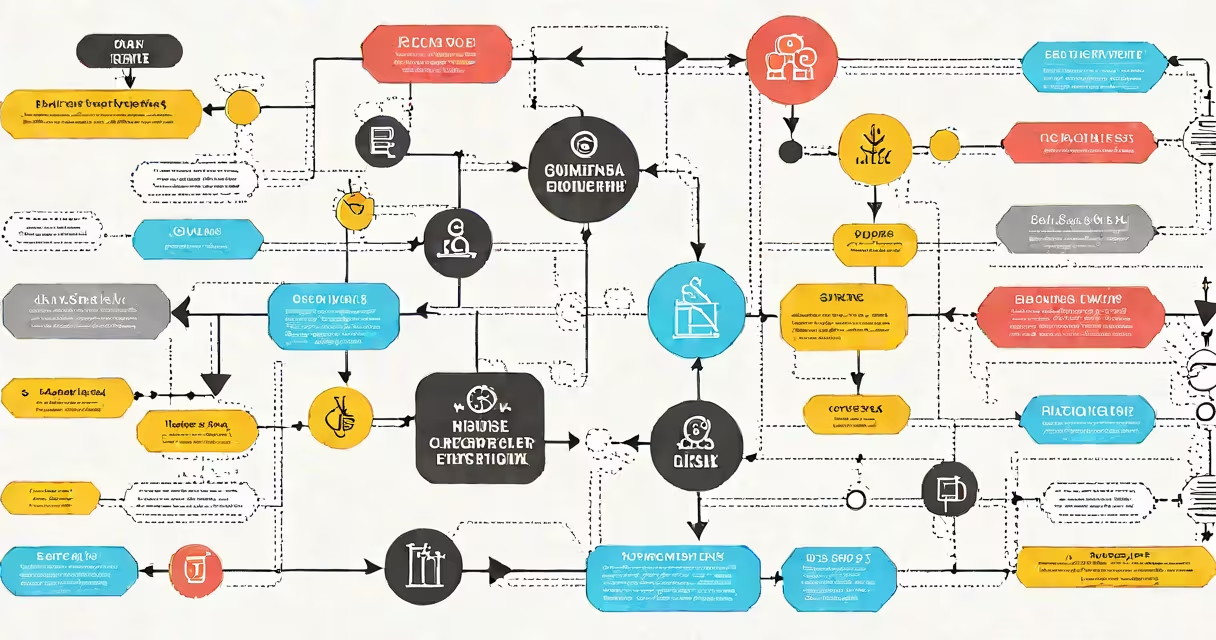
A workflow diagram is a visual representation of a sequence of tasks, decisions, and handoffs required to complete a specific process. It uses standardized shapes and arrows to show the flow from start to finish, making complex operations easier to understand and manage.
These diagrams are used across industries-from software development to healthcare-to document, analyze, and improve how work gets done. They turn abstract processes into clear, step-by-step paths that anyone can follow.
For example, a customer service team might use a workflow diagram to map how a support ticket moves from initial contact through escalation and resolution. The diagram shows who handles each step, what triggers the next action, and where delays often occur.
Workflow diagrams rely on a set of consistent symbols defined by international standards such as ISO 5807 and ANSI Y32.5. Each shape represents a different type of action:
When connected, these elements form a logical path. For instance, a manufacturing workflow might begin with "Receive raw materials" (rectangle), move to "Inspect quality" (diamond), then branch based on pass/fail results. If failed, the process loops back to rework; if passed, it continues to "Begin assembly."
Software tools like Lucidchart, Microsoft Visio, and draw.io automate layout and symbol placement, reducing errors and speeding up creation. These tools also allow version control and collaboration-critical for teams managing shared workflows.
Workflows vary by purpose. The most common types include:
| Type | Use Case | Example |
|---|---|---|
| Linear | Simple, sequential tasks | Order fulfillment: receive order → verify payment → ship → confirm delivery |
| Branching | Processes with conditional paths | Loan approval: check credit score → if below 650, reject; else, proceed to underwriting |
| Cyclical | Repetitive loops until completion | Software bug tracking: report → triage → fix → test → close (if unresolved, loop back) |
| Parallel | Multiple paths running simultaneously | Product launch: marketing campaign, website update, and inventory shipment happen at the same time |
Businesses use workflow diagrams to standardize operations, train new staff, audit compliance, and reduce errors. According to the Project Management Institute, documented workflows reduce project delays by up to 30% because they eliminate ambiguity about roles and timing.
In healthcare, a patient admission workflow helps all required forms, consent checks, and lab tests are completed before surgery. Without a diagram, missing steps can lead to legal risk or treatment delays.
Many people assume workflow diagrams are only for IT or technical teams. That's incorrect. They're valuable in finance, HR, education, and even personal planning.
Another myth is that creating a diagram requires advanced design skills. Tools like Canva and Miro offer drag-and-drop interfaces with pre-built templates. You don't need to draw shapes manually-just select them and connect them with lines.
A key correction: workflow diagrams are not the same as flowcharts. While both use similar symbols, flowcharts focus on logic and decision trees. Workflow diagrams emphasize roles, timing, and resource allocation. A flowchart might show "if temperature > 100°F, trigger alarm," but a workflow diagram specifies "Nurse checks vitals → reports to doctor → doctor orders medication."
As someone who has redesigned a hospital's discharge process using a workflow diagram, I found that clarity reduced average discharge times by 22%. Before the diagram, staff relied on memory and verbal instructions. After, everyone knew their role and the expected timeline.
To build an effective workflow diagram:
Consider a small e-commerce company launching a new product. Their current process had customers placing orders via email, which were manually entered into the system. Delays occurred due to missed emails and duplicate entries.
They created a workflow diagram with these steps:
By mapping this, they identified that the manual entry step was the bottleneck. Removing it cut processing time from 4 hours to 15 minutes. They also added a notification step for managers when orders exceeded $500, improving fraud detection.
After implementation, order accuracy rose from 89% to 98%, and customer complaints dropped by 40%.
Workflow diagrams are not just visuals-they are operational blueprints. When designed well, they reveal inefficiencies, clarify ownership, and enable continuous improvement. They are essential for scaling any process, whether in a startup or a multinational corporation.
Understanding what is a workflow diagram helps teams avoid confusion, reduce waste, and improve outcomes. Use them to make invisible processes visible and manageable.