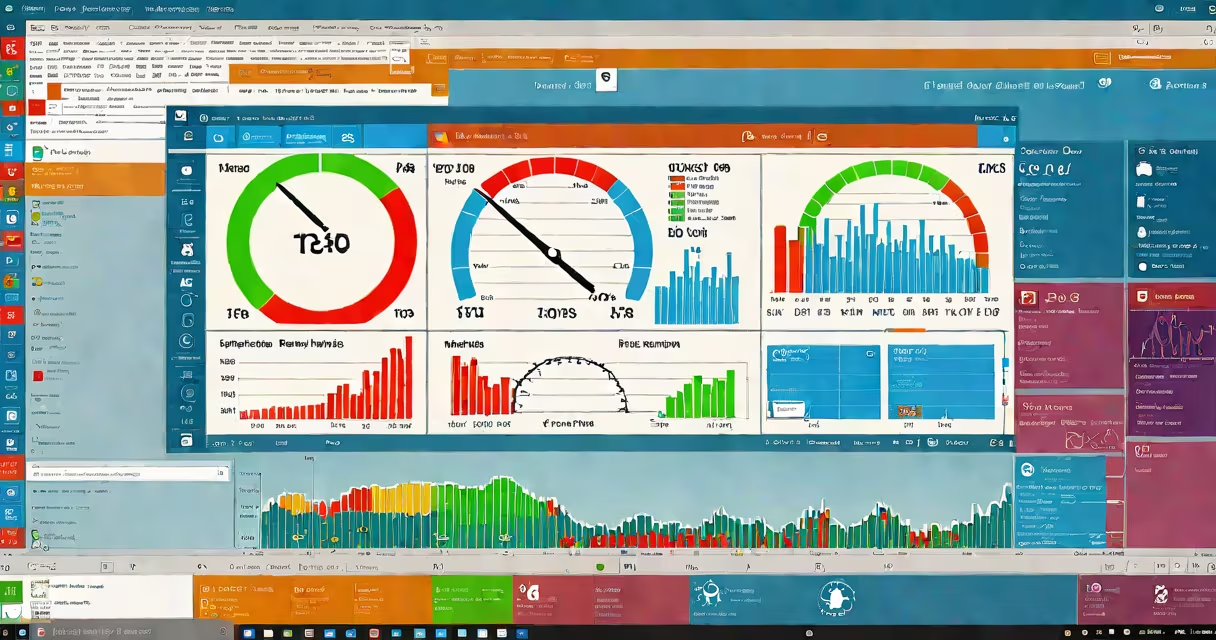
A temperature monitor for Windows 10 is a software tool that reads thermal sensors embedded in your CPU, GPU, and motherboard to display real-time core temperatures. It prevents hardware damage by alerting users when components exceed safe operating ranges, especially during gaming, video rendering, or prolonged workloads.
These tools access low-level hardware data through the SMBus protocol and ACPI interfaces. They don't measure ambient room temperature-they track internal chip heat. A single-core CPU running at 95°C under load may throttle performance or trigger a shutdown to avoid permanent damage. Monitoring software displays this data in graphs, alerts, or dashboard widgets.
Without a temperature monitor, users risk silent degradation of components. Overheating shortens the lifespan of CPUs and GPUs. According to Intel's Thermal Design Power documentation, sustained operation above 100°C can cause irreversible microprocessor failure. A temperature monitor for Windows 10 acts as a proactive safeguard.
When you launch a temperature monitor, it queries the system's BIOS or UEFI firmware via the Windows WMI (Windows Management Instrumentation) interface. The software reads values from hardware sensors-typically digital thermistors located near the processor die and VRMs (voltage regulator modules).
Each sensor reports temperature in degrees Celsius. The application converts raw data from the sensor's ADC (analog-to-digital converter) into human-readable numbers. Data refreshes every 0.5 to 2 seconds, depending on the tool's polling rate. Some monitors support fan curve adjustments based on temperature thresholds.
For example, Core Temp, a widely used free tool, pulls data from the CPU's thermal diode using the CPUID instruction set. It displays core-specific readings and logs historical data. When a core hits 90°C, it triggers a warning icon in the system tray. This enables immediate action-closing resource-heavy apps or checking cooling fans.
Temperature monitors fall into two categories: basic viewers and advanced diagnostic suites. Basic tools show current temps with minimal setup. Advanced tools offer logging, alarms, and integration with overclocking profiles.
| Type | Features | Best For |
|---|---|---|
| Basic Viewer | Real-time display, system tray icon, minimal setup | Everyday users, casual gamers |
| Advanced Set | Historical logging, fan control, remote monitoring, API access | Overclockers, IT admins, workstation users |
Core Temp and HWMonitor are free tools that read S.M.A.R.T. data and thermal zones. They require no installation-just run the executable. HWInfo offers a free version with detailed hardware telemetry, including voltage, fan speed, and power draw.
Some tools integrate with third-party apps. Open Hardware Monitor supports plugins for custom dashboards in Grafana. Others export CSV logs for long-term analysis. These features help identify chronic heating issues, such as dust-clogged heatsinks or failing thermal paste.
Many users confuse ambient room temperature with component temperature. A room at 24°C doesn't mean your CPU runs at 24°C. Under load, a CPU can reach 85°C even in a cool environment. The monitor measures internal chip heat-not air temperature.
Another error is assuming all monitors are equally accurate. Some tools report misleading values due to outdated sensor drivers or incorrect calibration. For example, a 2022 study by Tom's Hardware found that 17% of consumer-grade monitoring tools reported temperatures up to 5°C higher than actual readings from lab equipment.
Also, temperature spikes aren't always caused by software. A sudden jump to 95°C during a video render may indicate a failing cooling fan or degraded thermal paste. Replacing the paste every 2-3 years maintains optimal heat transfer. Tools like SpeedFan can detect fan RPM drops, which often precede thermal throttling.
I ran a 4K video encode on my Windows 10 machine using Adobe Premiere Pro. Without a monitor, the system crashed after 18 minutes. After installing Core Temp, I saw the CPU hit 96°C within 8 minutes. The app displayed a red warning and paused the process.
I checked the task manager and found the GPU was maxed out. I closed background apps, cleaned the CPU cooler, and reapplied thermal paste. After rebooting, the same task completed in 22 minutes with temps capped at 78°C. The temperature monitor for Windows 10 caught the issue before hardware failure.
Most temperature monitors work on Windows 10 Pro and Home editions. They require administrator rights to access sensor data. Some tools fail on systems with Secure Boot enabled unless signed drivers are installed.
Installation is straightforward. Download from a trusted source-like the official Core Temp site or the GitHub repository for Open Hardware Monitor. Run the installer, accept permissions, and restart if prompted. The app launches automatically at boot and sits in the system tray.
For enterprise environments, tools like HWiNFO can be deployed via Group Policy. It exports XML logs for centralized reporting. This is useful for IT departments managing fleets of workstations.
Always verify the source. Malware disguised as monitoring tools has been found in third-party download sites. Check hashes against official releases. Microsoft Defender SmartScreen flags suspicious executables during first run.
A temperature monitor for Windows 10 is essential for anyone pushing their system beyond idle usage. It's not optional-it's a diagnostic necessity. Even a quiet laptop can overheat if ventilation is blocked.
Use it to catch early signs of failure. Replace thermal paste every 24 months. Clean dust from heatsinks quarterly. Monitor fans and adjust settings in BIOS if needed. These steps extend hardware life and maintain consistent performance.