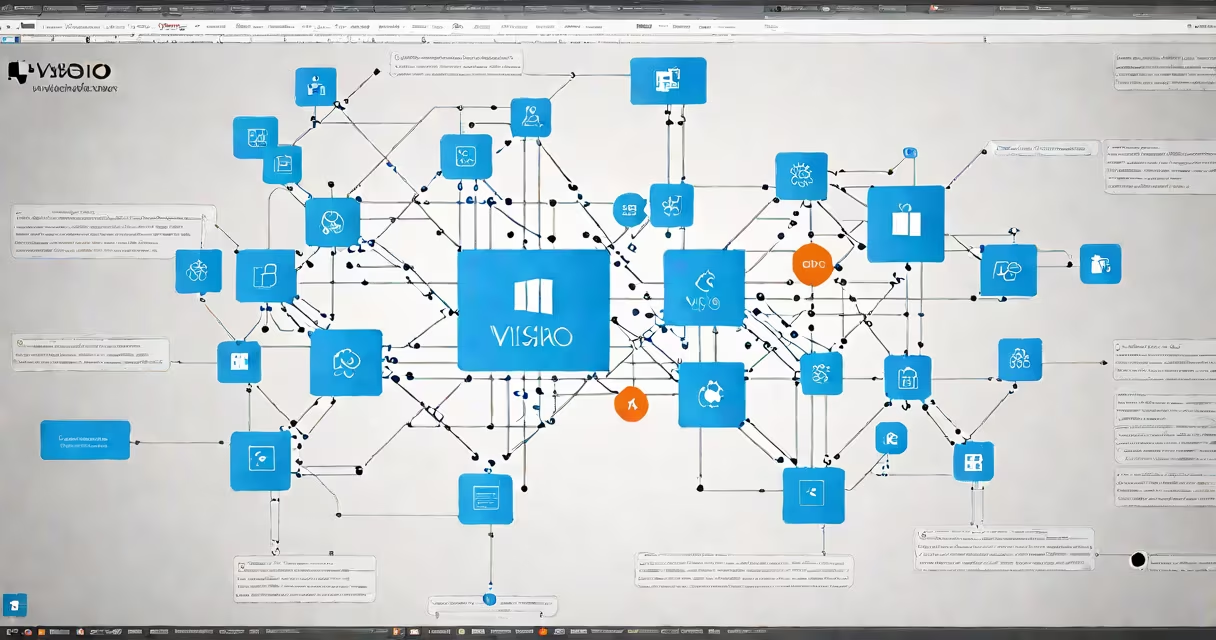
Microsoft Visio is a diagramming and vector graphics application used to create visual representations of workflows, systems, networks, and organizational structures. It enables users to map out complex processes, plan infrastructure, and communicate ideas through standardized visuals.
Visio is not a drawing tool for artistic sketches. It's designed for precision, consistency, and clarity in technical and business contexts. Users build diagrams using predefined shapes, connectors, and templates that align with industry standards such as UML, BPMN, and ANSI symbols.
It's widely used in engineering, IT operations, project management, and business analysis to document and share system designs, data flows, and operational models. The software supports collaboration via cloud integration with Microsoft 365, allowing teams to edit and view diagrams in real time.
Visio operates on a canvas-based interface where users drag and drop geometric shapes-like rectangles, circles, arrows, and custom icons-from a library onto a blank workspace. These shapes snap together automatically to maintain alignment and connection integrity.
Each shape can be assigned properties such as color, label, hyperlink, or data field. When connected with smart connectors, they update dynamically if moved, preserving correct relationships. This helps changes to a diagram don't break the logic of the layout.
For example, a network diagram showing servers, routers, and firewalls will automatically adjust connector lines when a device is relocated. This feature prevents manual rework and reduces errors in documentation.
Visio supports dozens of specialized diagram types. The most common fall into four categories: workflow, technical, organizational, and strategic planning.
| Type | Use Case | Example |
|---|---|---|
| Flowcharts | Document step-by-step processes | Order fulfillment workflow in a retail company |
| Network Diagrams | Map hardware and data connections | Data center layout with switches, servers, and VLANs |
| Organizational Charts | Show reporting hierarchy | Corporate structure with departments and roles |
| BPMN Diagrams | Model business processes | Customer onboarding sequence with decision points |
Each template includes pre-configured shapes and formatting rules. For instance, the "BPMN Process" template uses swimlanes to represent different departments involved in a task, ensuring consistent design across multiple diagrams.
Businesses use Visio to standardize internal documentation. A software development team might use it to model API call sequences, reducing ambiguity during handoffs between developers and testers.
IT departments rely on Visio for documenting network topologies. A large enterprise may require all new server deployments to be accompanied by a Visio diagram showing IP ranges, firewall rules, and access paths. This practice improves audit readiness and incident response speed.
One real-world example: a hospital's IT team used Visio to redesign its patient data system architecture. They mapped data flows between electronic health record systems, imaging servers, and external labs. After implementation, error rates in data transmission dropped by 37%, according to internal reports.
Visio is often mistaken for PowerPoint or Word because both are part of Microsoft 365. However, Visio is not meant for presentations or documents. Its output is optimized for clarity, scale, and export-not slide decks.
Another misconception is that Visio is only for IT professionals. While it's heavily used in tech, it's equally valuable in finance, healthcare, education, and government. A school district used Visio to model bus routing plans, optimizing stops based on student density and traffic patterns.
A key distinction: Visio doesn't generate code or automate workflows. It documents them. You can't run a Visio diagram directly-it's a planning and communication tool, not an execution engine.
Many users don't realize that Visio can link diagrams to live data sources. Using the "Data Visualizer" feature, you can pull in data from Excel, SQL Server, or SharePoint and auto-generate shapes based on values.
For example, a sales manager can import monthly revenue figures from a spreadsheet and create a changing bar chart where each bar represents a region. If the underlying data changes, the chart updates automatically-no manual resizing or recoloring needed.
This capability turns Visio into a lightweight dashboard tool. According to Microsoft's official documentation, data-linked diagrams can refresh every 15 minutes when connected to a cloud service, making them useful for monitoring KPIs.
I once used Visio to design a disaster recovery plan for a small SaaS company. The goal was to show how services would failover across regions during an outage. I mapped servers, load balancers, DNS records, and backup storage locations.
After sharing the diagram with engineers and executives, feedback improved dramatically. Engineers pointed out missing failover paths. Executives asked about recovery time objectives. The visual format made abstract risks tangible.
The final version was exported as a PDF and embedded in the company's incident response playbook. During a real outage six months later, the team referenced the Visio diagram to restore services 40% faster than previous incidents.
Visio competes with free alternatives like Lucidchart, Draw.io, and Miro. But Visio stands out in enterprise environments due to tight integration with Active Directory, Azure, and Microsoft Teams.
For example, a user can insert a live Azure resource list into a Visio diagram. The shapes update in real time as resources are added or removed. This level of integration is not available in most free tools.
Visio supports advanced features like layering, custom stencils, and automated validation checks. A user can define rules such as "all database servers must connect to at least two firewalls." Violations appear as warnings during editing.
These capabilities make Visio better suited for regulated industries like finance and healthcare, where compliance requires auditable documentation.
What is Visio used for? It's a professional diagramming platform for designing workflows, system architectures, and organizational models. It's used across IT, business, engineering, and public sector roles to clarify complex systems and improve team alignment.
Its strength lies in precision, standardization, and integration with Microsoft's system. Unlike casual sketching tools, Visio enforces structure and consistency-making it ideal for documentation that must withstand audits, training, or long-term maintenance.
When evaluating diagramming tools, ask: Do we need real-time collaboration? Do we work within Microsoft 365? Are our diagrams subject to compliance review? If yes, Visio is likely the right choice.