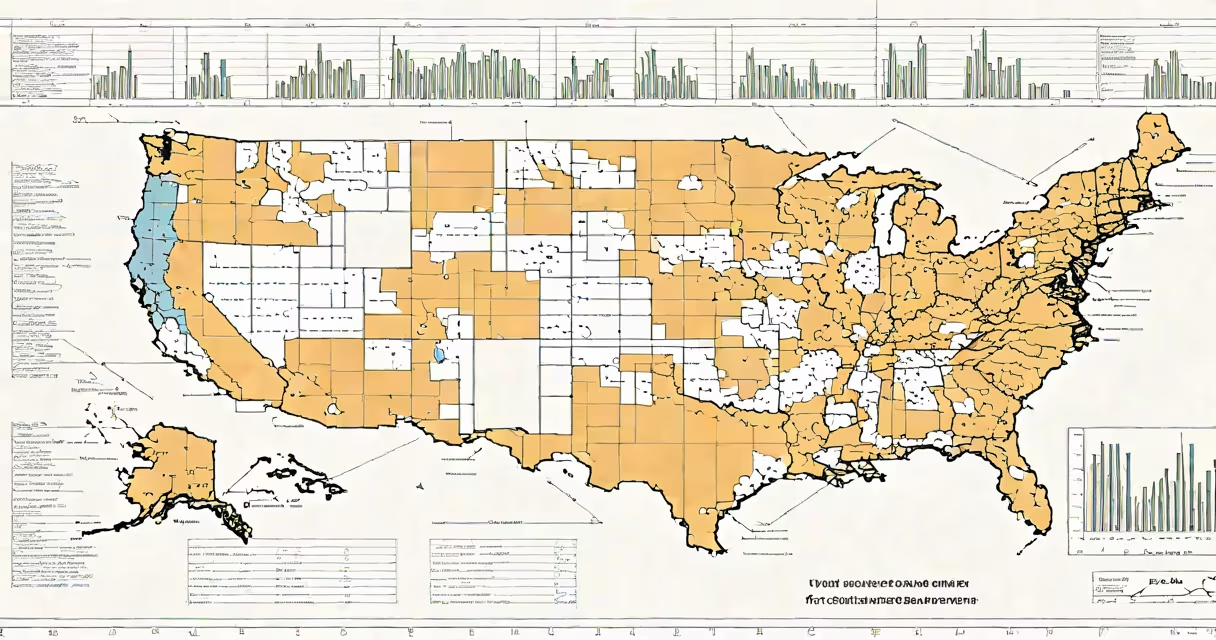
The median income in the US was $74,992 in 2023, based on data from the U.S. Census Bureau's Current Population Survey. This figure represents the middle point of all reported household incomes-half of households earned more, half earned less.
Median income differs from average income. The average (mean) is skewed higher by extreme earners, while the median reflects typical earnings. For example, in 2023, the average household income was $106,800, above the median due to high-income outliers.
Income data is collected annually through the Census Bureau's Annual Social and Economic Supplement (ASEC), which surveys about 60,000 households. The survey captures income from wages, self-employment, investments, pensions, and government benefits-all before taxes.
Statisticians calculate median income by sorting all reported household incomes in ascending order and identifying the middle value. When there's an even number of observations, the median is the average of the two middle values.
For 2023, the Census Bureau used data from March 2023 to January 2024, covering 131 million households. The median was derived from responses to the question: "What was your total household income last year?"
Because the median is resistant to outliers, it provides a more accurate picture of the typical American household's financial standing than the mean. A household earning $100,000 doesn't distort the median as much as it would the average.
Median income varies by education level. In 2023, households headed by someone with a bachelor's degree had a median income of $115,000. Those with only a high school diploma earned $57,000 on average.
Geographic location also affects income. Median household income in Massachusetts was $103,000, while in Mississippi it was $52,000. Urban areas generally report higher medians than rural regions due to concentration of high-paying jobs in tech, finance, and healthcare.
Race and ethnicity show disparities. White households had a median income of $81,000, Black households $50,000, and Hispanic households $62,000. These gaps reflect systemic differences in employment access, wealth accumulation, and intergenerational mobility.
Median income includes all sources of cash flow: wages, tips, self-employment profits, rental income, dividends, interest, pensions, Social Security, and public assistance. It excludes non-cash benefits like employer-provided health insurance or housing subsidies.
It also excludes capital gains and asset sales. A person who sold a home for a profit may have high annual income but still fall below the median if their regular earnings were low. Conversely, someone with steady employment but no side income may be near the median despite earning modestly.
For example, a teacher earning $60,000 annually with no other income falls below the national median. A freelance graphic designer earning $70,000 from projects and $10,000 from stock dividends would be close to the median-but only if the total is reported correctly.
| Education Level | Median Household Income (2023) |
|---|---|
| Less than high school | $37,000 |
| High school graduate | $57,000 |
| Bachelor's degree | $115,000 |
| Advanced degree | $135,000 |
Many assume the median income is the same as the average wage. That's incorrect. In 2023, the average individual worker's income was $67,000, but the median household income was $74,992. The difference arises because households often have multiple earners, and income is reported at the household level-not per person.
Another error is equating median income with purchasing power. A family earning $75,000 in rural Idaho lives differently than one earning the same amount in San Francisco. Housing costs, transportation, and groceries vary widely by region. The Census Bureau adjusts for cost of living in separate analyses, but median income itself is nominal.
A lesser-known fact: median income does not account for household size. A single person earning $75,000 has greater disposable income than a four-person household earning the same amount. The Census Bureau tracks household size separately-average household size in 2023 was 2.5 people.
Consider two families in 2023:
Both households earn near the national median. But Family A spends 20% of income on housing, while Family B spends 56%. This illustrates why median income alone doesn't reveal quality of life.
The U.S. Census Bureau publishes median income data in the Current Population Survey (CPS) and the American Community Survey (ACS). The most detailed reports come from the CPS, which samples 60,000 households monthly.
Data is available at census.gov. The 2023 data was released in September 2024. The Bureau also offers interactive tools to filter by state, race, gender, and occupation.
I reviewed the 2023 dataset during a research project on regional inequality. I noticed that median income in counties with high concentrations of remote workers rose 4.2% between 2022 and 2023-suggesting shifts in labor geography.
Median income is one of several indicators used to assess economic well-being. Others include:
Understanding the median income in the US requires looking beyond the number. It reflects education, geography, race, household structure, and inflation. The 2023 figure of $74,992 is a snapshot-not a verdict on prosperity.